.svg)
.svg)


Visibility into your infrastructure is absolutely essential, both when optimizing performance and preventing issues from cropping up. Real-time and even periodic monitoring are powerful practices. Naturally, there are numerous ways to go about doing so. Theres also a multitude of tools.
While death by choice seems like the initial problem, the true challenge is customization. Every team has different preferences. Server architectures and configurations differ greatly. Unfortunately, for some use cases, even the best tools must make assumptions for better or worse. Such rigid approaches might actually contribute to increased downtime, undermine performance, and decrease security.
Companies running Windows-based servers have an excellent option at their disposal: PowerShell. The powerful scripting language is highly flexible. Because PowerShell relies on human-friendly coding, its relatively easy to get started. Whats the best part of writing your own code? You can design solutions around any parameters you choose. Thats not to say PowerShell scripting has no learning curve. However, the potential for substantial costs savings is high. You also wont be held hostage by a third partys support availability, should problems arise (as they always do).
Establishing monitoring is dependent on knowing ones priorities and the basic mechanisms behind monitoring. Well first dive into those.
Monitoring and PowerShell Essentials
First and foremost, youll need to figure out what you want to monitor before getting started. Many a company has put the cart before the horse; resultant monitoring solutions have turned out subpar. Multiple factors may be vying for your attention:
- Performance
- Process utilization
- Memory and CPU usage
- Network and user activity
- Server response times
- Tread utilization
- Bandwidth and throughput
This list isnt exhaustive, but should be a decent starting point. Reaching a consensus on focus areas is essential even when creating simple monitors. Say we want to stray from heavy metrics, however. Telemetry data is useful, yet it might be too detailed for your purposes.
Keeping things simple
For example, we know a server at its most basic may be active or inactive. Performing that status check is fundamental to maintaining your ecosystem. Because server requests are made over the internet, HTTP responses from certain origins are expected. Investigation is likely necessary if a port goes offline.
You must also create a basic chain of escalation: what issues, at what severity, will grab whose attention? PowerShell scripts trigger a pre-determined action, which leads to a desired result. This is often called a state. If a bad state is discoveredlike an incorrect responsesomeone must be notified.
This might be someone on the IT side, DevOps side, or even technical higher-ups. One person might be enough to mitigate the issue. Multiple employees might have to extinguish a fire. Prompt alerting via PowerShell can help resolve hiccups faster.
Writing your PowerShell monitors
Your monitors will be contained within a PowerShell scriptan encompassing file comprised of multiple, written functions. Youll define actions, good states, bad states, and outputs within said functions.
Youll also include your desired trigger frequency. PowerShell scripts only run once by default. We circumvent this minor snag by creating a task, which can call a script whenever the user wishes. This is possible through PowerShells looping functionality. The languages organized, variable-based syntax gives us the flexibility to define freely.
Any scripting file youll create for PowerShell will be saved with a source code file extension. This might appear as
C:\ServerMonitors.pslwithin your system; or you can name it whatever youd like.
Building blocks
Next, youll want to know your verbiage. Managing services can introduce a host of functions into the equation. However, well want to focus on some key cmdlets:
- Get
- Test
Each cmdlet also includes a modifier, which provides context for the request. This is connected to the cmdlet by a dash, e.g. Get-Service -ComputerName. If you want to test your servers functionality, you may elect to code something like Test-HTTP. These cmdlets are preceded by function notation, so that ones first line may look like this:
function Test-HTTP {
Functions also include parameters. If you dont define parameters for your servers, then your PowerShell scripts wont discern between different outputs. These general functions will return general results. Properly defining parameters (like computer names, good responses, or bad responses) will ensure your monitoring output is contextually informative.
If you want to define a positive response, such as an HTTP status code, youll have to denote this as an integer ([int]). Such codes might be 200 (successful, OK response), 202 (accepted, but waiting), or anything else related to server functionality. Because servers ultimately respond to API requests, its useful to design a monitoring function that confirms healthy responses. Youll also need to include strings ([string]) to denote key monitoring objects or data types.
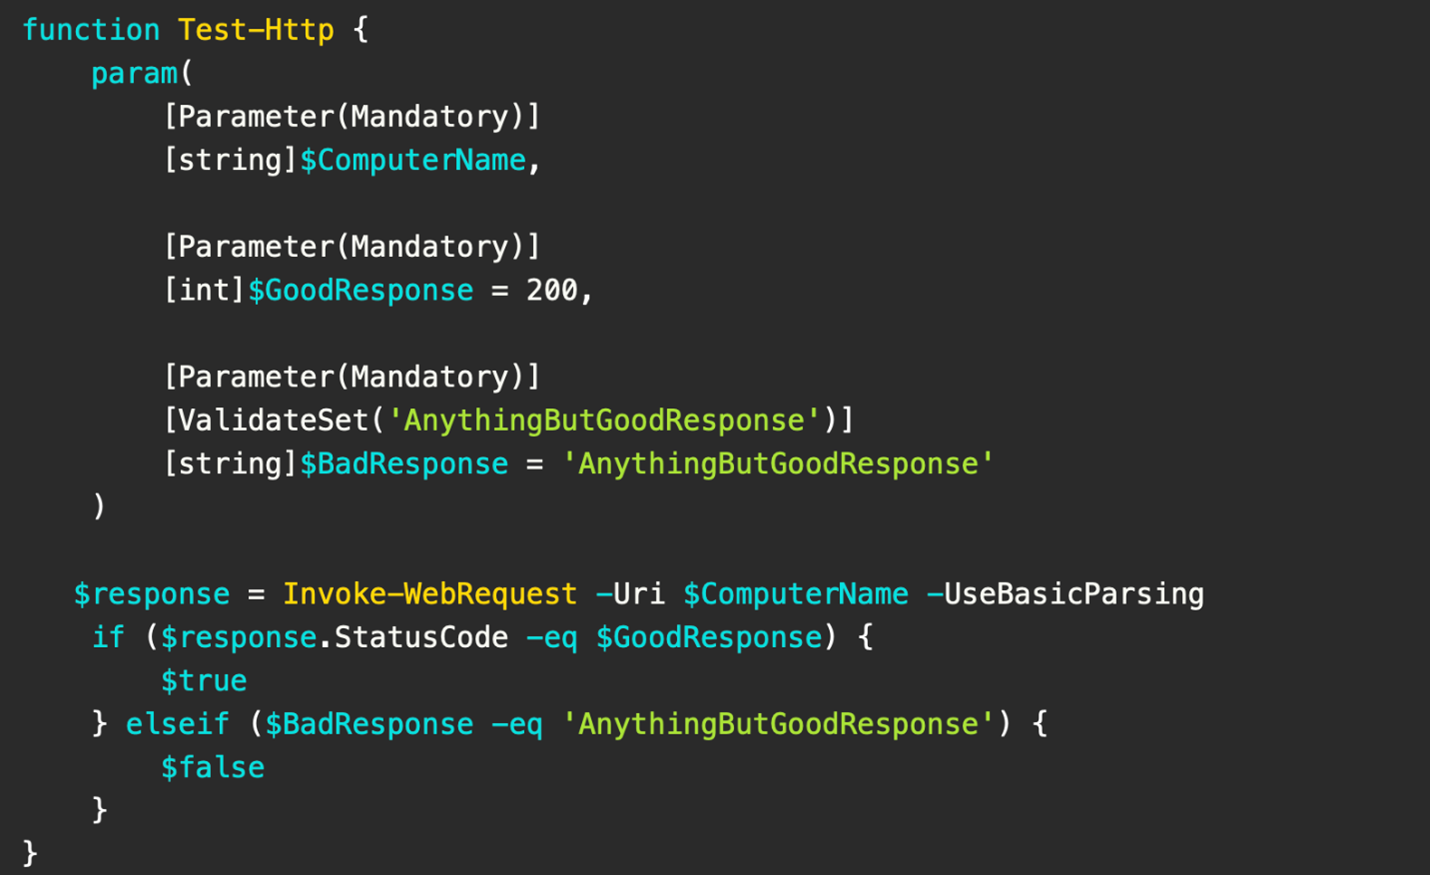
What a basic HTTP response test function might look like. Courtesy of Adam the Automator.
Youll also want to validate and bake condition statements into your PowerShell functions. This will instruct your server to produce certain outputsshould statuses be true or false. PowerShell will follow these instructions accordingly, and return a valuable result to you or your team.
Kicking off your PowerShell monitoring
Building your monitoring functions is step one. However, youll also have to write a mechanism for triggering these monitoring scripts. The invocation script activates your relevant pre-made functions, while defining any supplemental tasks pegged for completion. This naming scheme follows our previous monitoring scheme:
C:\CallServerMonitors.psl
Structure is incredibly important here. Youll be organizing your various monitors into hash tables, which act as compact, organized data structures. These contain key and value pairs. You might define your server names and monitor names. This invocation script can also trigger alerts based on backend results. By doing this, you can also apply specific rules as desired.
Frequencies and final considerations
Your external tasks will activate these core scripts as often as you wish. While its useful to monitor some server parameters more often, others are decidedly less mission-critical. Microsoft considers these monitoring scripts to be idiomatic, since theyre highly dependent on cmdlets and functions.
Running large numbers of PowerShell monitoring scripts simultaneously might incur a resource cost; since they dont leverage .NET directly, they utilize the pipeline. It may be best to stagger scripts that NEED to run often and those that arent critical. Thankfully, the inherently-lightweight nature of your functions will help mitigate those concerns.
These examples arent exhaustive. There are many more monitoring avenuesyou can count on PowerShell to have your back when it comes to server visibility.

PRTG and ScriptRunner Monitoring and automation at its best
Find out how PRTG Network Monitor and ScriptRunner work hand in hand to fulfil all your IT infrastructure monitoring needs!
Related links
- ScriptRunner ActionPacks will help you automate tasks
- Try out ScriptRunner here
- ScriptRunner: Book a demo with our product experts