.svg)



When a single Action fails, you know exactly where to look. The Reports section shows what ran, against which target, with which parameters, and what the script wrote to its log. Workflows change that picture, because a workflow is more than a chain of scripts: it also contains the logic between them, and none of that logic is PowerShell. ScriptRunner therefore gives you two layers of visibility, and knowing which one holds your answer is most of the work.
The Familiar Baseline: Debugging a Single Action
For a single Action, the Reports section is the whole story. Every execution produces a record showing when it started, the target it ran against, how long it took, who started it, the parameters used, and the output the script produced. That is sufficient because the execution and the script share the same boundary: one Action means one script, so whatever went wrong happened inside it. It is also what makes ScriptRunner's execution history usable as an audit trail rather than just a troubleshooting aid, as covered in Audit in ScriptRunner: Making Enterprise Automation Traceable and Defensible.
Why a Workflow Breaks That Model
A workflow is an orchestration, not a script. Take the onboarding example from One Workflow, Many Actions: Where Do the Parameters Come From?: a form is submitted, the values arrive at a trigger node as a structured payload, and expressions map them onto the parameters of New-EntraUser and then New-ExMailbox. Add a condition that routes contractors down a different branch, and the workflow contains a good deal of behavior that no PowerShell log will ever record.
This is where the familiar debugging habit fails. The run is marked as failed, you open the execution record expecting a stack trace, and there is nothing useful there. The script log is silent because no script ran: a mapping expression resolved to an empty value, a condition evaluated the opposite way to what you assumed, or the trigger never delivered the payload at all. Asking which line of PowerShell failed is the wrong question, because the honest answer may be that none of them did.
Layer One: Workflow Runs in the Reports Section
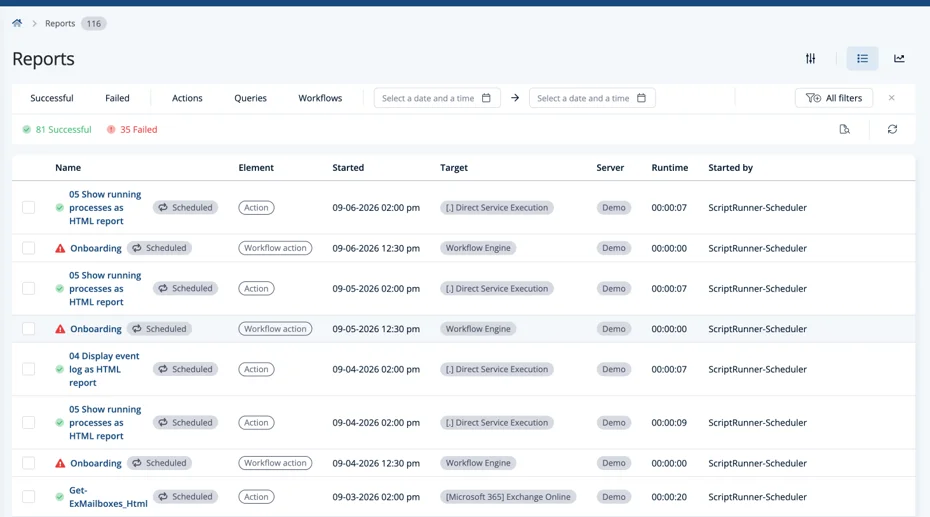
Workflows have not disappeared from your existing reporting. Every workflow run produces a record in the same Reports section as everything else. The difference is in the Element column: a workflow run is labelled Workflow action rather than Action, and its Target is the Workflow Engine rather than a machine or a Microsoft 365 endpoint. The filter tabs work as you would expect, and the Workflows tab isolates workflow runs from individual Action executions.
Expanding a Workflow Run into the Actions It Executed
A workflow record is not a single flat entry. Expand it and you see the Actions that ran as part of that workflow, each as a full execution record in its own right.

The run above executed New-EntraUser against Microsoft Graph and New-ExMailbox against Exchange Online. Each child row has its own start time, target, runtime, and log, so the moment a problem is narrowed to one step you are back on familiar ground. The Started by column also captures the causal chain: the workflow was started by a named user, while each Action underneath it was started by the Workflow Engine. That distinction lets you prove a mailbox was created as part of an onboarding request rather than by someone running the Action directly.
Reading the Failure Signature
Before opening anything, the shape of the failed record tells you which layer to go to. A workflow that failed and has child Actions underneath it failed inside a script: one of those children will be marked as failed, its log will contain the error, and the investigation ends in the Reports section.
A workflow that failed with no child Actions and a runtime of zero never reached a script at all. The failed onboarding runs in the first screenshot are exactly this case, and the failure happened in the workflow layer. The third pattern is the awkward one: a workflow that succeeded but produced the wrong result, because every step did what it was told and what it was told was wrong. Both send you to the second layer.
Layer Two: Node-Level Detail in the Workflow Engine
Open the workflow itself and switch from the Editor tab to the Executions tab. ScriptRunner's workflow engine, introduced in Enterprise Version 8 and built on integrated n8n technology, keeps its own execution history at the level the Reports section cannot reach: the individual node.
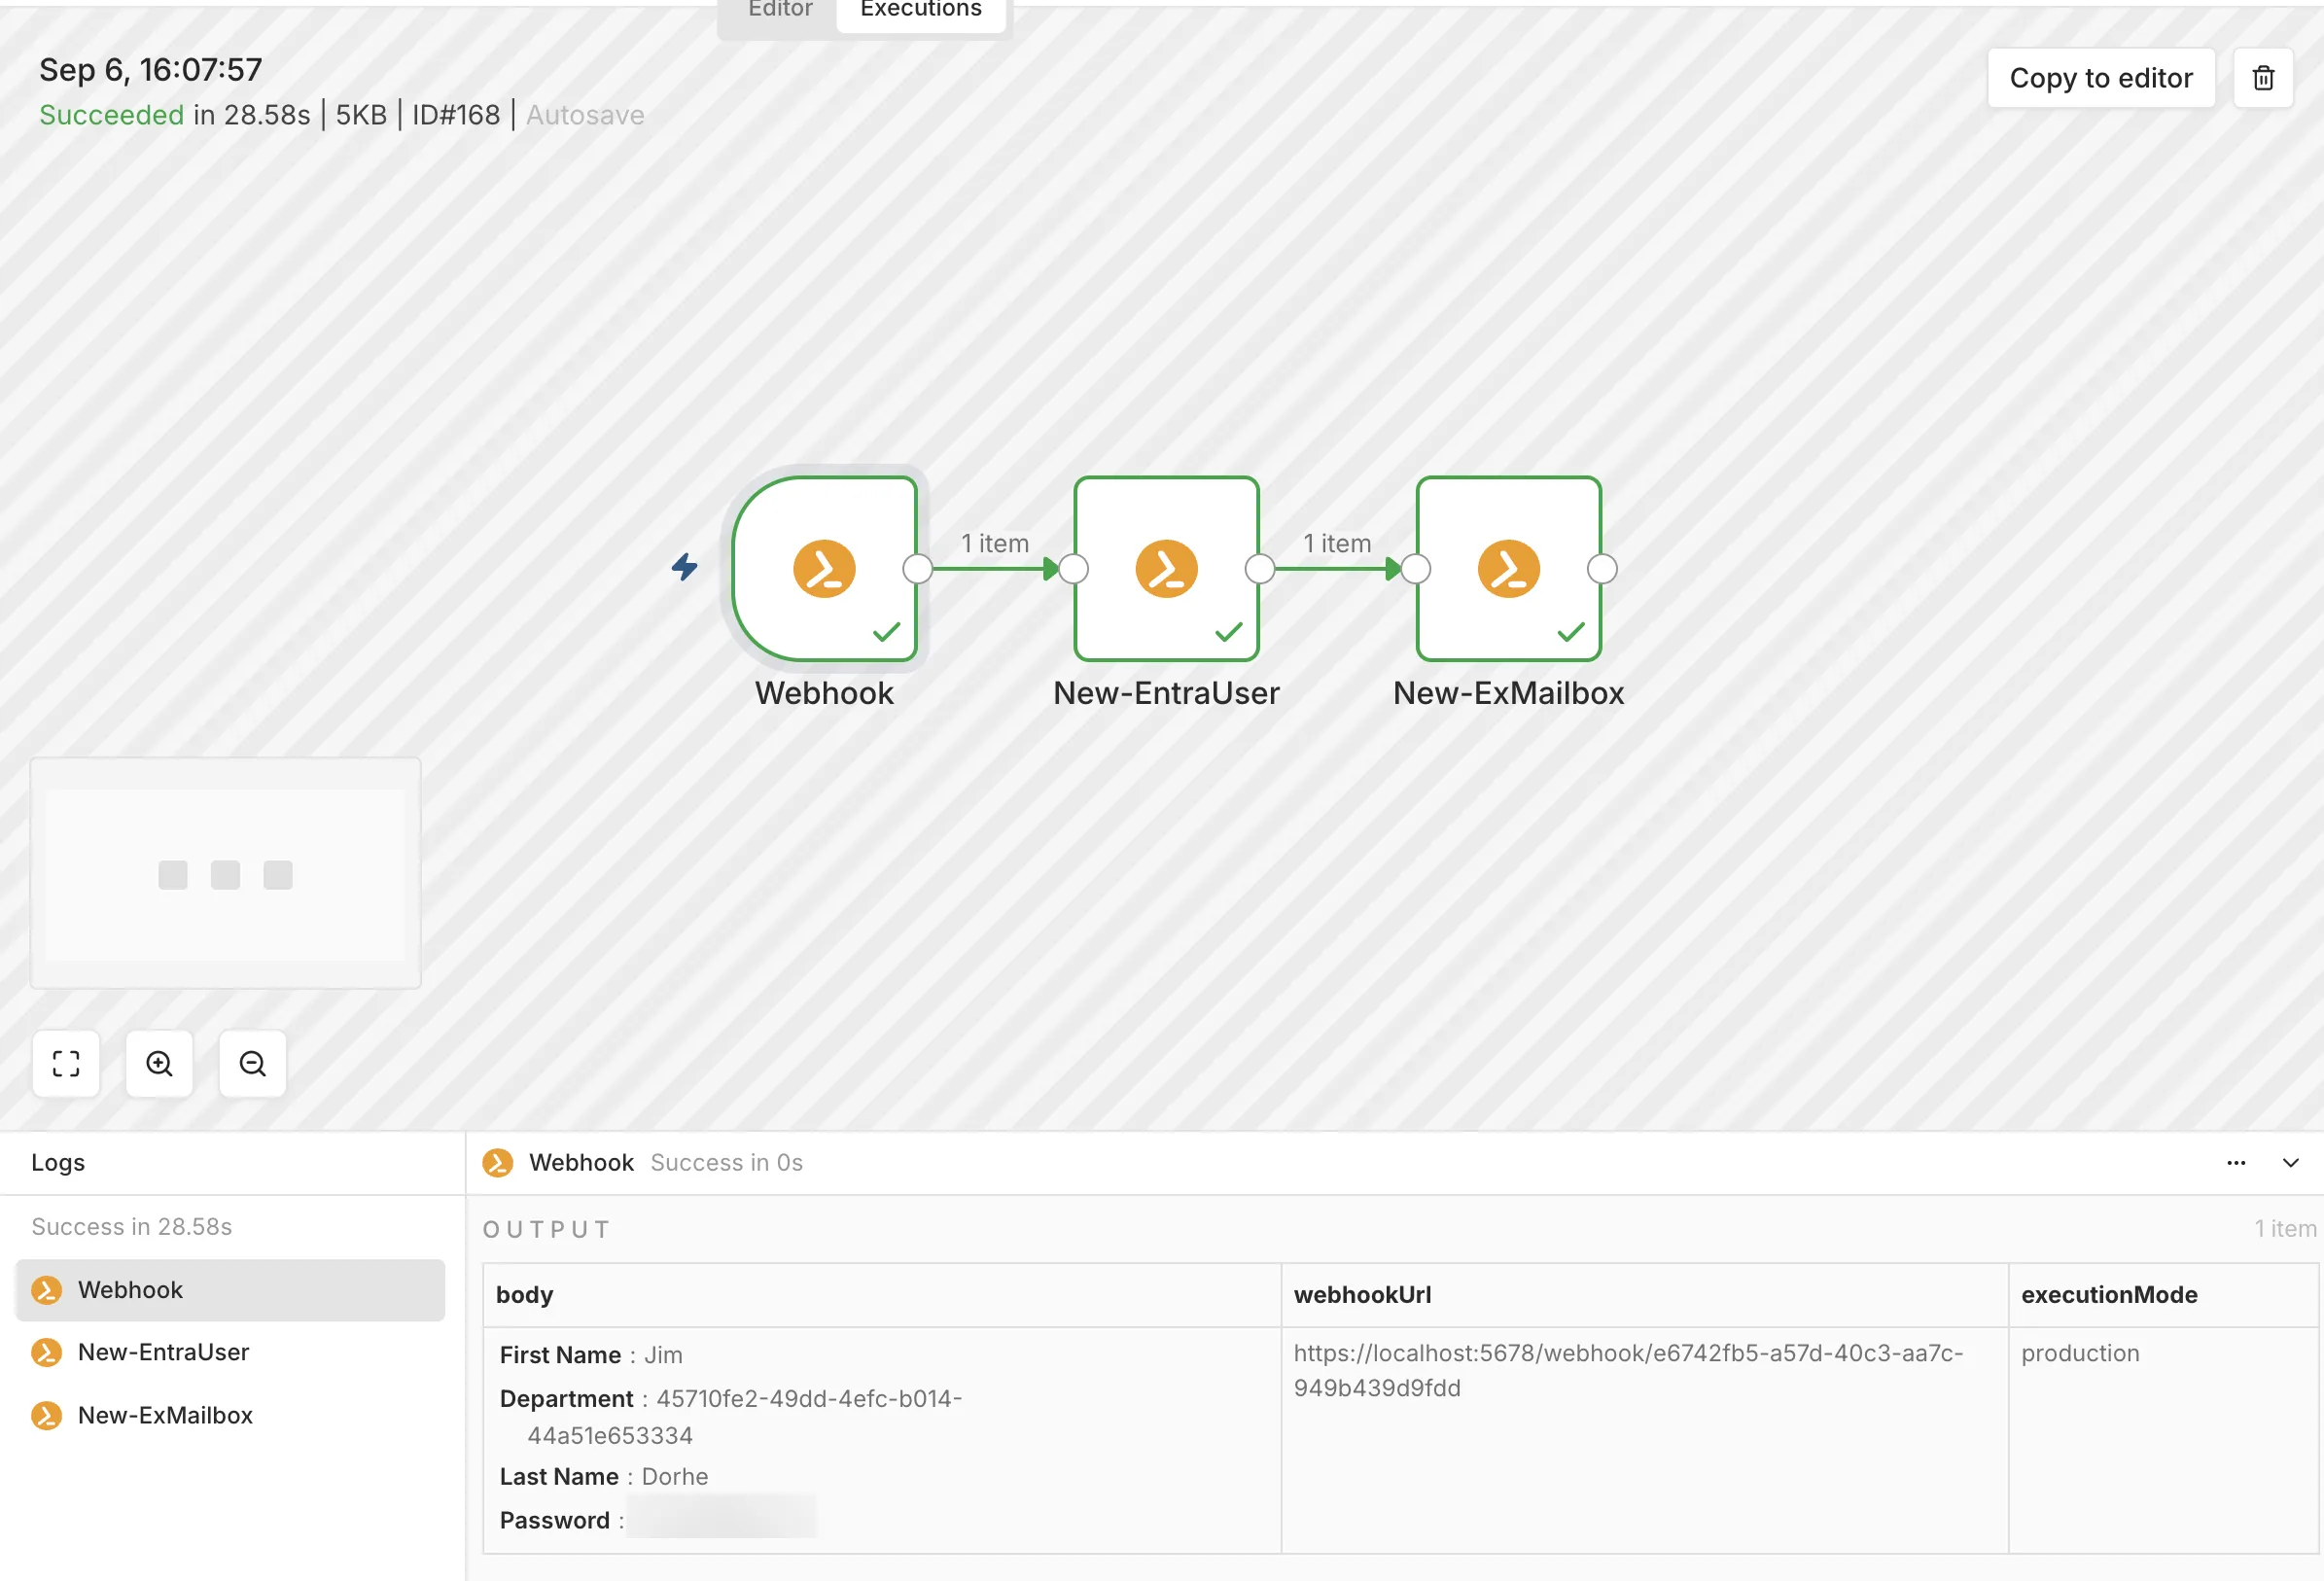
Every run is listed with its status and precise duration. Select one and the canvas replays it: completed nodes are outlined in green with a check mark, the connections are labelled with the number of items that actually passed, and a failed run stops visibly at the node that broke.
Below the canvas, the Logs panel shows the input and output of whichever node you select, and this is the part with no equivalent in the Reports section. Selecting the webhook trigger above displays exactly what arrived: a body containing First Name, Last Name, Department, and Password. Note that Department is the object ID the query-linked drop-down returned rather than the readable name the requester picked, which is the kind of detail that decides whether a downstream mapping was ever going to work. The password is masked here because a credential is better drawn from the credential store than typed into a form, precisely because payloads are this visible.
Duration is diagnostic on its own. A failure after fifteen seconds means an Action was called and something went wrong while it ran. A failure after a few hundred milliseconds never got as far as calling anything, and those are the same events that appear in Reports with a runtime of zero. When a fix is needed, Copy to editor loads that run's state back into the designer, so you correct the mapping against the real data rather than a reconstruction of it.
Key Benefits
Workflows stay inside your existing reporting. A workflow run is a normal record in the Reports section, filterable and auditable alongside every Action.
The Action layer keeps its full detail. Each Action executed by a workflow produces the same complete execution record it would produce on its own.
The orchestration layer stops being a black box. Node-level input and output make failures in mappings, conditions, and triggers something you diagnose rather than guess at.
The failure signature points you to the right layer. Child Actions and runtime tell you whether the problem sits in a script or in the workflow around it before you open a single log.
Failed runs are replayed, not reconstructed. Past executions are preserved with their real data and load straight back into the editor.
Key Takeaways
- Debugging a single Action is self-contained, because the execution and the script are the same boundary
- A workflow adds triggers, mappings, and conditions that produce no PowerShell output, so a script log alone cannot explain every failure
- Workflow runs appear in Reports with the Element type Workflow action and the Workflow Engine as their target
- Expanding a workflow record shows each Action it executed, with full logs, targets, and runtimes
- Actions run by a workflow show Workflow Engine in the Started by column, preserving the causal chain for audit
- A failed run with child Actions points to a script; one with no children and near-zero runtime points to the workflow layer
- The Executions tab replays each run on the canvas and exposes every node's input and output
- Copy to editor loads a past run back into the designer so fixes are made against real data
Bottom Line
A workflow fails in one of two places: inside a script, or in the orchestration around it. The Reports section answers the first case completely and tells you, by what it does not show, when you are in the second. The workflow engine's execution history then takes over, replaying the run node by node with the data it actually carried.
To see how workflow-level visibility could shorten your troubleshooting, book a meeting with us.