
14 min read
Privacy Management with PowerShell – Let's look at the core features of Priva!
All you need to know about Privacy Management, privacy management policies, rules, and subject rights requests.
Visibility into your infrastructure is absolutely essential, both when optimizing performance and preventing issues from cropping up. Real-time and even periodic monitoring are powerful practices. Naturally, there are numerous ways to go about doing so. There’s also a multitude of tools.
While death by choice seems like the initial problem, the true challenge is customization. Every team has different preferences. Server architectures and configurations differ greatly. Unfortunately, for some use cases, even the best tools must make assumptions — for better or worse. Such rigid approaches might actually contribute to increased downtime, undermine performance, and decrease security.
Companies running Windows-based servers have an excellent option at their disposal: PowerShell. The powerful scripting language is highly flexible. Because PowerShell relies on human-friendly coding, it’s relatively easy to get started. What’s the best part of writing your own code? You can design solutions around any parameters you choose. That’s not to say PowerShell scripting has no learning curve. However, the potential for substantial costs savings is high. You also won’t be held hostage by a third party’s support availability, should problems arise (as they always do).
Establishing monitoring is dependent on knowing one’s priorities — and the basic mechanisms behind monitoring. We’ll first dive into those.
This list isn’t exhaustive, but should be a decent starting point. Reaching a consensus on focus areas is essential — even when creating simple monitors. Say we want to stray from heavy metrics, however. Telemetry data is useful, yet it might be too detailed for your purposes.
You must also create a basic chain of escalation: what issues, at what severity, will grab whose attention? PowerShell scripts trigger a pre-determined action, which leads to a desired result. This is often called a state. If a bad state is discovered—like an incorrect response—someone must be notified.
This might be someone on the IT side, DevOps side, or even technical higher-ups. One person might be enough to mitigate the issue. Multiple employees might have to extinguish a fire. Prompt alerting via PowerShell can help resolve hiccups faster.
You’ll also include your desired trigger frequency. PowerShell scripts only run once by default. We circumvent this minor snag by creating a task, which can call a script whenever the user wishes. This is possible through PowerShell’s looping functionality. The language’s organized, variable-based syntax gives us the flexibility to define freely.
Any scripting file you’ll create for PowerShell will be saved with a source code file extension. This might appear as
C:\ServerMonitors.pslEach cmdlet also includes a modifier, which provides context for the request. This is connected to the cmdlet by a dash, e.g. Get-Service -ComputerName. If you want to test your server’s functionality, you may elect to code something like Test-HTTP. These cmdlets are preceded by function notation, so that one’s first line may look like this:
function Test-HTTP {
Functions also include parameters. If you don’t define parameters for your servers, then your PowerShell scripts won’t discern between different outputs. These general functions will return general results. Properly defining parameters (like computer names, good responses, or bad responses) will ensure your monitoring output is contextually informative.
If you want to define a positive response, such as an HTTP status code, you’ll have to denote this as an integer ([int]). Such codes might be 200 (successful, OK response), 202 (accepted, but waiting), or anything else related to server functionality. Because servers ultimately respond to API requests, it’s useful to design a monitoring function that confirms healthy responses. You’ll also need to include strings ([string]) to denote key monitoring objects or data types.
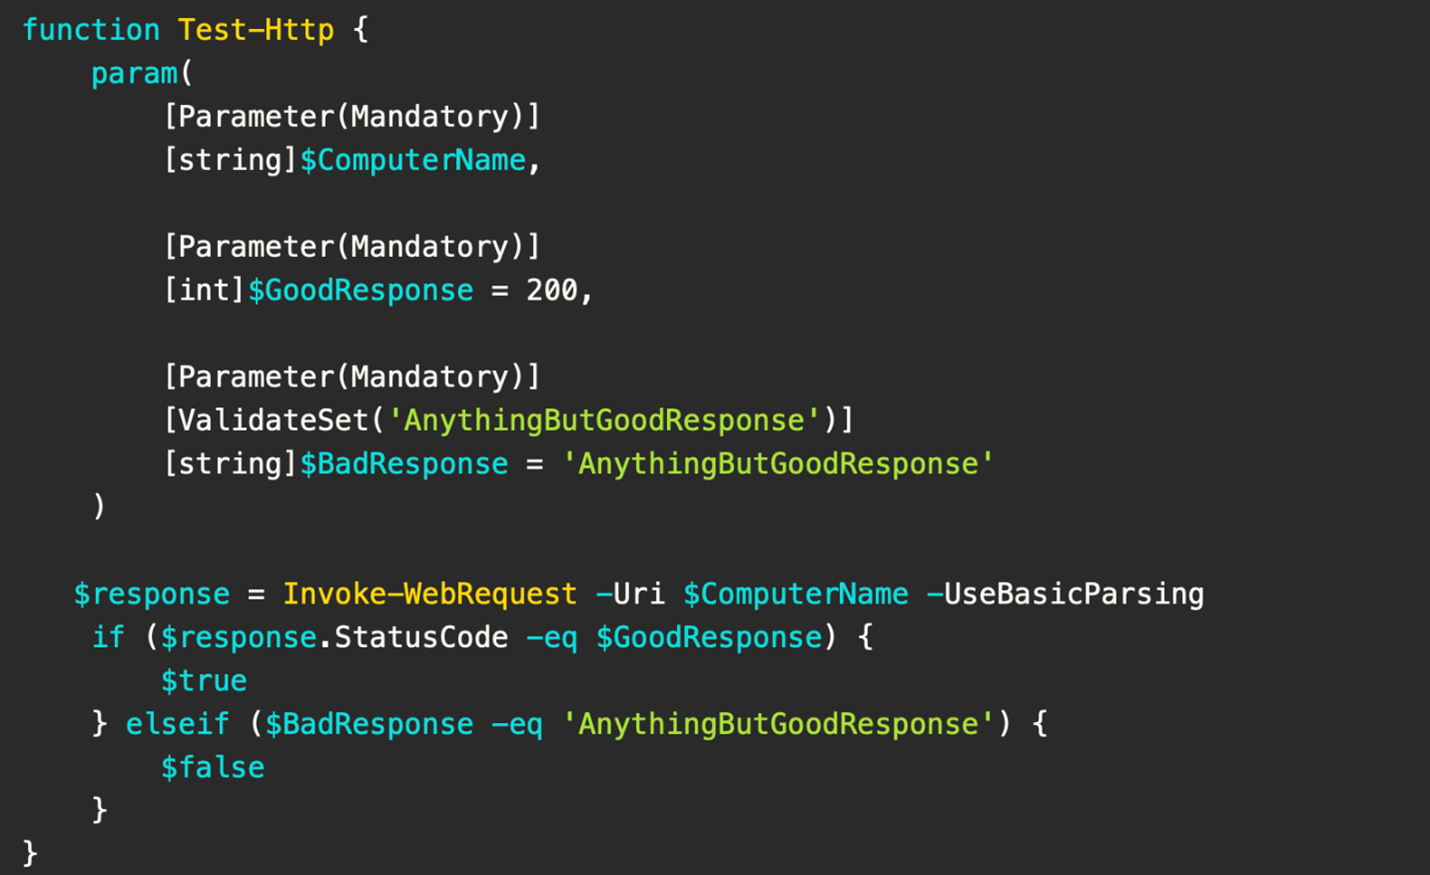
What a basic HTTP response test function might look like. Courtesy of Adam the Automator.
You’ll also want to validate and bake condition statements into your PowerShell functions. This will instruct your server to produce certain outputs—should statuses be true or false. PowerShell will follow these instructions accordingly, and return a valuable result to you or your team.
C:\CallServerMonitors.pslStructure is incredibly important here. You’ll be organizing your various monitors into hash tables, which act as compact, organized data structures. These contain key and value pairs. You might define your server names and monitor names. This invocation script can also trigger alerts based on backend results. By doing this, you can also apply specific rules as desired.
Running large numbers of PowerShell monitoring scripts simultaneously might incur a resource cost; since they don’t leverage .NET directly, they utilize the pipeline. It may be best to stagger scripts that NEED to run often and those that aren’t critical. Thankfully, the inherently-lightweight nature of your functions will help mitigate those concerns.
These examples aren’t exhaustive. There are many more monitoring avenues—you can count on PowerShell to have your back when it comes to server visibility.

Jul 16, 2024 by Damian Scoles
All you need to know about Privacy Management, privacy management policies, rules, and subject rights requests.
Jul 3, 2024 by Matthias Jütte
Every last Friday of July, we get to celebrate System Administrator Appreciation Day, a special day dedicated to...
Jul 2, 2024 by Philip Lorenz
Windows PowerShell 5.1 is usually preinstalled and the default – is it worth switching to PowerShell 7, or will it lead...
Adam is a 20+ year veteran of IT and experienced online business professional. He’s an entrepreneur, IT influencer, Microsoft MVP, blogger, trainer, author and content marketing writer for multiple technology companies.
